three methods of data analysis

Review and compare Raw data
By comparing rainfall (green section) to soil moisture readings (pink section) we can see how rainfall impacts soil moisture over time around the Infiltech device to get an understanding for how the Infiltech® system of devices works. The 12", 24", and 36" columns represent sensor depths in a sensor stack (multiple sensors placed directly over or under each other below ground). The three left pink sections are one stack, A, and the right three pink sections are one stack, B. From this data we can understand vertical and transverse movement of water below ground. If we also look at sensor stacks placed farther left or right of these stacks we can interpret longitudinal flow. This data can show us trends, but can be very noisy due to site conditions such as lifts of different fill material. This method allows for comparison and insights into how water is moving around a site, but it is a slow comparison process and there is no way to visualize what is happening site wide.

Graphical comparison
The soil moisture sensors come with software that plots soil moisture values of each sensor (each sensor has its own color) attached to a logger (which holds up to 8 sensors) over time. This allows for quick comparison of sensors and for the ability to see sensors dry over time (line goes up), wet with a rain event (line goes down), and then begin to dry again. It also shows how sensors in different locations wet at different times from each other, due to their location on the site and depth. However, there isn't a way to visualize where these sensors are on the site or a way to look at an entire site, because only one logger can be plotted at a time.

Plot moisture for every sensor on a site in time and space
To try and remedy some of the shortcomings of the previous two methods a Python program was written and GIS, survey, and soil moisture data were combined to plot soil moisture data for every sensor on a site for a particular time, in space. On these plots, like the one pictured above, the soil moisture correlates to the darkness of the shade of blue, with dark blue being wetter and light blue being drier. A variety of these plots can be compared very quickly to understand how soil moisture is changing on a site over time, where on a site water goes to at different times, and how an installation as a whole manages water.
MOdeling
We can see the physical results of water being captured and spread around the sites. Now we need to describe that capture and movement of water.
Conceptual model
We need to track the movement of water on the surface, into the Infiltech® device, through the Infiltech® system, and into the surrounding soil.
For overland flow we consider Manning's Equation, for subsurface flow through the devices we consider Darcy Flow (saturated flow), and for infiltration we consider the Green-Ampt Equation (from the surface into the soil) and Darcy Flow (from the saturated devices into the surrounding soil).
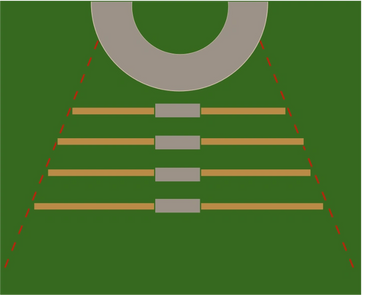
Included figures are for an overland flow installation.


Conceptual model
How do we put these conceptual processes together?
We utilize a Geographic Information System (GIS), which is spatial (landscape based) and three-dimensional.
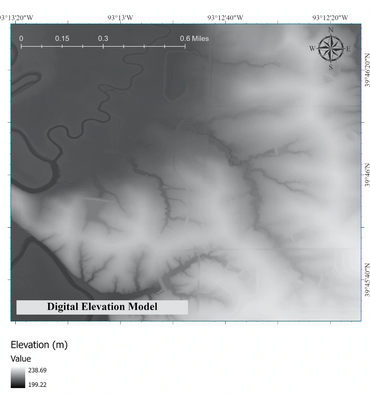
LIDAR imagery and site surveys are utilized to produce a Digital Elevation Model (DEM) that describes the topography such as slopes, flow directions, and location and extent of depressions.
The GIS processes water movement through each cell and layer of the system and site, utilizing the above equations.


